Morning Star A Bullish Reversal Pattern and Its Significance in Crypto Trading Signals
Chapter 1: Understanding Technical Analysis in Cryptocurrency Trading
What is Technical Analysis?
Technical analysis is a methodology used in financial markets, including cryptocurrency trading, to forecast future price movements based on historical price data and trading volume. This approach assumes that historical price and volume data contain valuable information about future market behavior. Technical analysts use various tools, including candlestick patterns, to make informed trading decisions.
The Role of Candlestick Patterns
Candlestick patterns are a fundamental component of technical analysis. These patterns provide visual representations of price movements over specific time periods, often depicted as candlesticks on a price chart. Each candlestick contains information about the opening, closing, high, and low prices for that period. By analyzing patterns formed by these candlesticks, traders can identify potential entry and exit points in the market.
The Significance of Crypto Signals
In the cryptocurrency trading realm, where prices can fluctuate dramatically within minutes, having access to reliable signals is paramount. Crypto signals are trading recommendations generated by analyzing technical indicators, patterns, and market data. These signals assist traders in making informed decisions about buying, selling, or holding specific cryptocurrencies. Understanding and effectively using crypto signals, including crypto day trade signals and daily cryptocurrency trading signals on platforms like Crypto Signals Telegram, can significantly improve a trader’s chances of success.
Introduction to the Pattern
Definition and Basics
The pattern is a bullish reversal pattern found in candlestick charts. It typically forms at the end of a downtrend and signals a potential trend reversal to the upside. This pattern consists of three candlesticks: the first is a large bearish (red or black) candle, followed by a smaller candle with a small body (can be bullish or bearish), and finally, a large bullish (green or white) candle.
The Three Components of a Morning Star
a. The First Candle: The pattern begins with a large bearish candle, indicating that sellers have control of the market. This candle can be of varying lengths, but it should have a significant downward move.
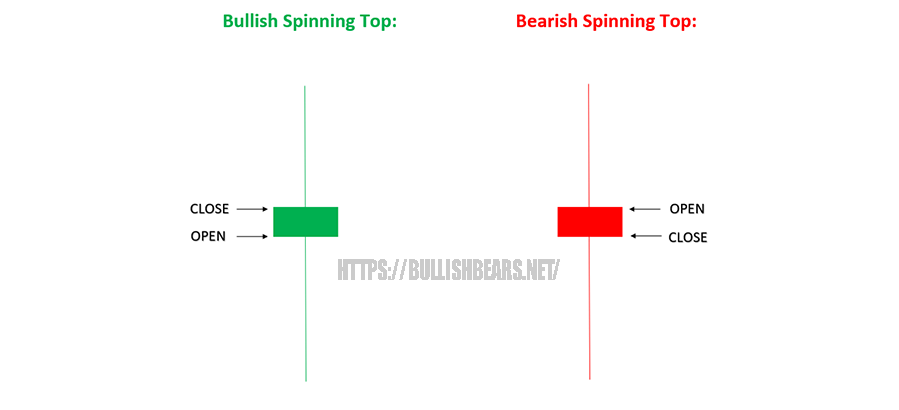
b. The Second Candle: The second candle in the pattern is a smaller one, often with a small body, indicating indecision in the market. This candle can be bullish (green or white) or bearish (red or black) and is usually characterized by its smaller size and relatively small trading range.
c. The Third Candle: The third and final candle of the pattern is a large bullish candle that closes well above the first candle’s close. This candle signifies that bulls have taken control of the market, potentially marking the beginning of an uptrend.
Variations of the Pattern
There are variations of the pattern, including the Evening Star, the Abandoned Baby Bottom, and the Doji Star. These variations have subtle differences in their candlestick formations and interpretations, but they all share the common theme of signaling potential trend reversals.
How to Identify the Pattern
Locate the Downtrend
The pattern is most effective when it forms at the end of a downtrend. Traders should first identify a clear and established downtrend on the price chart. This downtrend is characterized by a series of lower lows and lower highs.
Observe the Morning Star Formation
Once a downtrend is identified, traders should watch for the formation of the pattern. This involves closely monitoring the three consecutive candles described earlier. It’s essential to note the size and shape of each candle and the relationship between them.
Confirm the Pattern
Confirmation is a crucial step when using the Morning Star as a bullish reversal signal. To confirm the pattern, traders should look for additional signs, such as an increase in trading volume during the pattern’s formation or the presence of other technical indicators supporting a bullish reversal.
The Psychology Behind the Morning Star Pattern
Understanding Market Sentiment
To understand the significance of the pattern, it’s essential to grasp the underlying market sentiment at play. During a downtrend, sellers are in control, and pessimism prevails in the market. However, as the pattern forms, a shift in sentiment occurs.
Interpretation of the Morning Star’s Components
Each component of the pattern reflects a specific change in market sentiment:
- The first candle represents bearish dominance, with sellers pushing prices lower.
- The second candle, with its small body, shows indecision and a potential weakening of the bearish momentum.
- The third candle, a large bullish one, demonstrates a decisive shift in sentiment as bulls take control, potentially initiating an uptrend.
Bullish Reversal Expectations
The pattern’s significance lies in its potential to mark the end of a downtrend and the beginning of a bullish reversal. Traders who recognize this pattern often expect prices to rise in the subsequent trading sessions. This anticipation is rooted in the idea that the pattern reflects a shift from pessimism to optimism among market participants.
Significance of Volume in the Pattern
Volume Analysis in Crypto Trading
Volume analysis is a critical aspect of technical analysis in crypto trading. Trading volume represents the number of units of a cryptocurrency traded within a specified time period. It provides insights into the strength and validity of price movements.
Volume Confirmation for Morning Star
When identifying a pattern, traders should pay attention to trading volume. An increase in volume during the formation of the Morning Star can serve as confirmation of the pattern’s validity. This surge in volume suggests that buyers are becoming more active, strengthening the potential bullish reversal.
Backtesting the Morning Star Pattern
Historical Performance in Cryptocurrency Markets
To assess the effectiveness of the pattern in crypto trading, traders often engage in backtesting. Backtesting involves analyzing historical price data to see how the pattern would have performed in past market conditions.
Limitations of Backtesting
While backtesting can provide valuable insights, it has limitations. Historical price data may not fully represent future market conditions, and the effectiveness of the Morning Star pattern can vary across different cryptocurrencies and timeframes. Traders should use backtesting results as a guideline rather than a definitive prediction of future performance.
Practical Application of Morning Star in Crypto Trading Signals
Entry Points and Stop-Loss Placement
Traders can use the pattern as a signal for potential entry points in long positions. After confirming the pattern, a trader may consider opening a long position near the close of the third bullish candle. Stop-loss orders are essential to manage risk and limit potential losses in case the market moves against the trade.
Setting Profit Targets
Setting profit targets is another crucial aspect of trading based on the Morning Star pattern. Traders can use technical analysis tools such as resistance levels, Fibonacci extensions, or previous price swings to determine potential price targets for their long positions.
Risk Management
Effective risk management is paramount in crypto trading. Traders should never risk more than they can afford to lose and employ proper risk management strategies, such as setting stop-loss orders and diversifying their trading portfolio.
Combining Morning Star with Other Technical Indicators
Moving Averages
Traders often combine the pattern with moving averages to enhance their trading signals. Moving averages smooth out price data and help identify trends. When a Morning Star pattern forms after a prolonged downtrend and crosses above a key moving average, it can strengthen the bullish signal.
Relative Strength Index (RSI)
Traders can use RSI in conjunction with the pattern to confirm oversold conditions in the market. When the RSI indicator is in oversold territory (below 30), and a Morning Star pattern forms, it can reinforce the bullish reversal signal.
Fibonacci Retracement
Fibonacci retracement levels are horizontal lines that indicate potential support and resistance levels based on key Fibonacci ratios. Traders can use Fibonacci retracement in combination with the pattern to identify potential price reversal points and set profit targets more accurately.
Real-Life Examples of the Morning Star in Crypto Markets
Case Study 1: Bitcoin (BTC)
In this case study, we will examine historical price charts of Bitcoin to identify instances where thepattern signaled potential trend reversals.
[Include charts and explanations of each instance]
Case Study 2: Ethereum (ETH)
Similar to the Bitcoin case study, we will analyze Ethereum’s price charts to identify patterns and their subsequent price movements.
[Include charts and explanations of each instance]
Case Study 3: Altcoins
Altcoins, or alternative cryptocurrencies, often exhibit different price patterns and behaviors compared to major cryptocurrencies like Bitcoin and Ethereum. We will explore how the Morning Star pattern applies to various altcoins, highlighting both successful and unsuccessful instances.
[Include charts and explanations of selected altcoins]
Common Pitfalls and Challenges
False Signals
One common challenge when using the pattern is the possibility of false signals. Not every Morning Star formation leads to a significant trend reversal. Traders must exercise caution and consider additional factors, such as market conditions and other technical indicators, to filter out false signals.
Emotional Trading
Emotions can play a detrimental role in trading. When a trader becomes overly emotional and ignores risk management strategies, they may incur substantial losses. It’s crucial to maintain discipline and follow a well-thought-out trading plan when using the Morning Star pattern.
Market Manipulation
In the crypto market, where liquidity and regulations can vary, market manipulation is a real concern. Traders should be aware of potential manipulation and use caution when interpreting candlestick patterns, including the Morning Star.
Conclusion
The Morning Star Pattern in Crypto Trading
The Morning Star pattern is a powerful bullish reversal signal that can be a valuable addition to a trader’s toolkit in the crypto market. However, it should be used in conjunction with other analysis techniques and risk management strategies to maximize its effectiveness in the highly volatile world of cryptocurrency trading.


